Gain Perspective on Market Volatility and Your Portfolio
August 12, 2024
 By Tom Limoges
Vice President - InvestmentsFrom January of 2016 to December of 2017 (two-years) the markets did something remarkable. Stock market volatility dipped to lows not seen since 2007. On top of this, the S&P 500 didn’t record a monthly loss greater than 1%. Over that 24-month period, the S&P 500 only had five negative months and the cumulative return for those two years was 36.4%. Why is this important? In recent months, market volatility hit very low levels. Until the selloff in technology stocks last month, the markets went a full 356 days without a greater than 2% daily market decline, the longest streak going back to February 2007. While recent volatility can impact portfolio balances, below are a few charts to give perspective when looking at the current market activity.
Annual Returns and Intra Year Decline

Source: JP Morgan Guide to the Markets as of August 8th, 2024
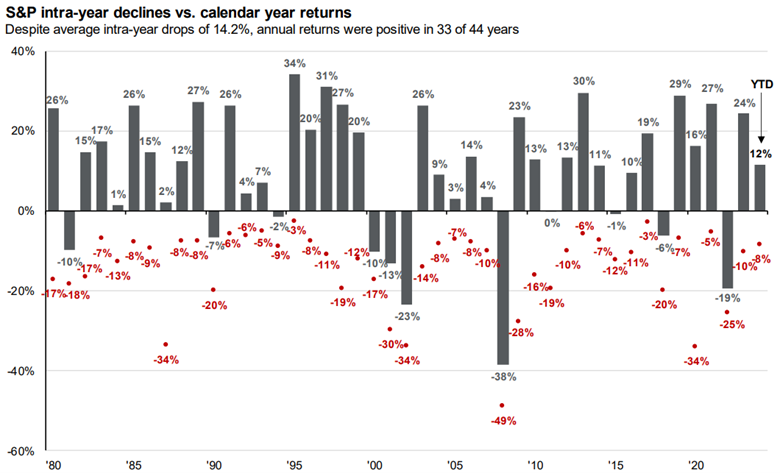
Around this office, we often refer to the above chart as the Pox chart. In the chart, annual returns are graphed (in grey) going back to 1980. The red dots (Pox) represent the largest drop for the index in that corresponding year. Taking the long-term perspective, the stock market experienced a 14.2% average intra-year decline, but annual returns were positive 75% of that time. As of last Friday and including a drop of 8% because of the recent volatility, the index is still positive year-to-date by 12%. Recent market volatility, while can be frustrating, is part of a normal market environment.
Time, Diversification and the Volatility of Returns

Source: JP Morgan Guide to the Markets as of August 8th, 2024
Regular readers of these blogs know that our investment staff often mention in their writing the importance of maintaining a well-diversified portfolio. Spoiler alert, this article is no different. The above chart shows the volatility of returns for stocks, bonds and a diversified 60/40 (60% stock/40% bond) portfolio. The time periods are short term (1-year) on the left all the way to long term (20-year) on the right. The two most important takeaways from this chart are:
- Markets can be volatile short term, regardless of your portfolio allocation
- Diversification helps improve the consistency over longer term time periods
Stocks produced the highest returns over the last 70+ years at 11.4%. However, it is nearly impossible to plan on that return (short term) given the wide range of outcomes over 1-year time period. Even bonds and a diversified 60/40 portfolio can produce wide outcomes in the short term. When looking at outcomes over the 5, 10, and 20 year time periods, a diversified portfolio helps dampen volatility.

Source: Franklin Templeton Data as of 12/31/2023
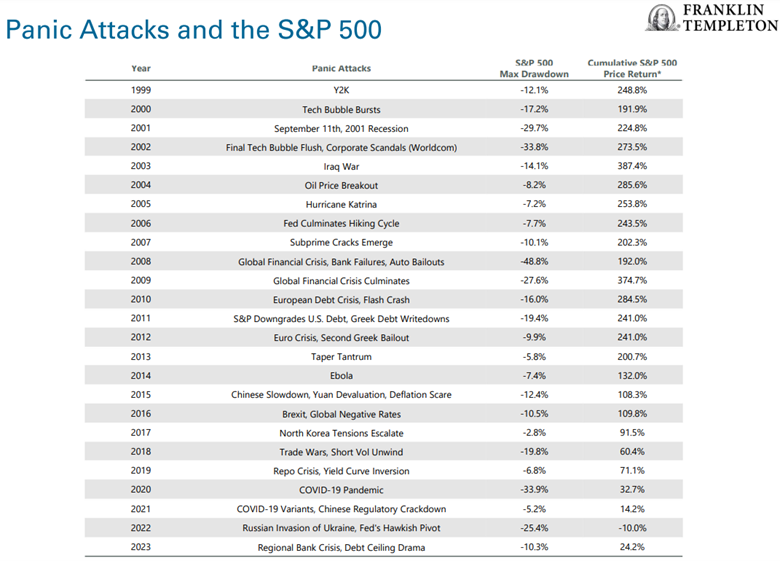
Perspective is often difficult to gain but important to maintain during periods of market volatility. This last bit of information details the various panic attacks (market moving events) over the last 20+ years and subsequent drawdowns. The far column on the right shows the cumulative price return in the years following in the drawdown. After all but one of these negative events, the market moved forward and produced positive returns.
Taking the long-term approach shows that volatility will come and go; our advice is to not let it drive your investment allocation. Stay consistent, stay diversified, and maintain your focus, and reach out to your Advisor today for guidance.