
How to Stay a Disciplined Investor During Volatile Times
March 30, 2020
 By Krista Eberly, CFP®
Securities Analyst IIWhat a month March has been! Stocks fell into bear market territory, volatility spiked to record levels and even safe haven assets declined. There has been no place to hide.
1) Don't Let Monday Get You Down
First, let’s start with the stock market environment so far this year. Below is a chart from the Wall Street Journal’s Daily Shot® and FactSet. It shows the cumulative S&P 500 price change for every day of the week through Tuesday March 24.
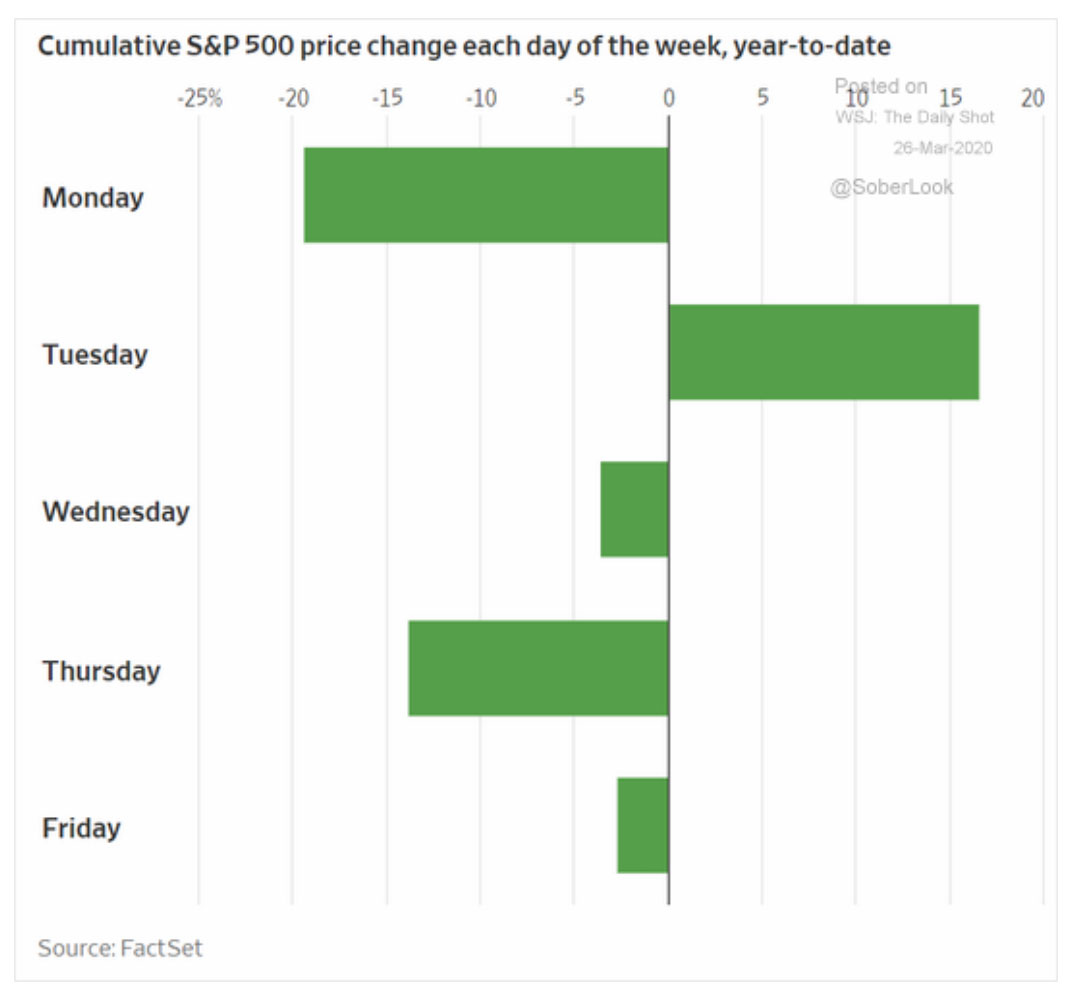
You will notice that Mondays experience the sharpest selloffs followed by a rebound on Tuesday. Why? Fear builds over the weekend from the negative headlines and this leads to selling on Monday. Investors realize that Monday is an overreaction and stocks bounce back the following day. We saw this behavior last week. The Dow Jones Industrial Average declined 3% Monday but came roaring back Tuesday to increase 11.4%, its largest daily increase since 1933!
2) Use History as a Guide
Now, let’s shift the focus to prior drawdowns in the markets and their subsequent recoveries. We can use history as a guide to give us an idea of what to expect this time around. The first chart below, also from the Wall Street Journal’s Daily Shot®, shows every drawdown the Dow Jones experienced greater than 30%. There are only eight instances prior to the current one; these drawdowns are rare occurrences.
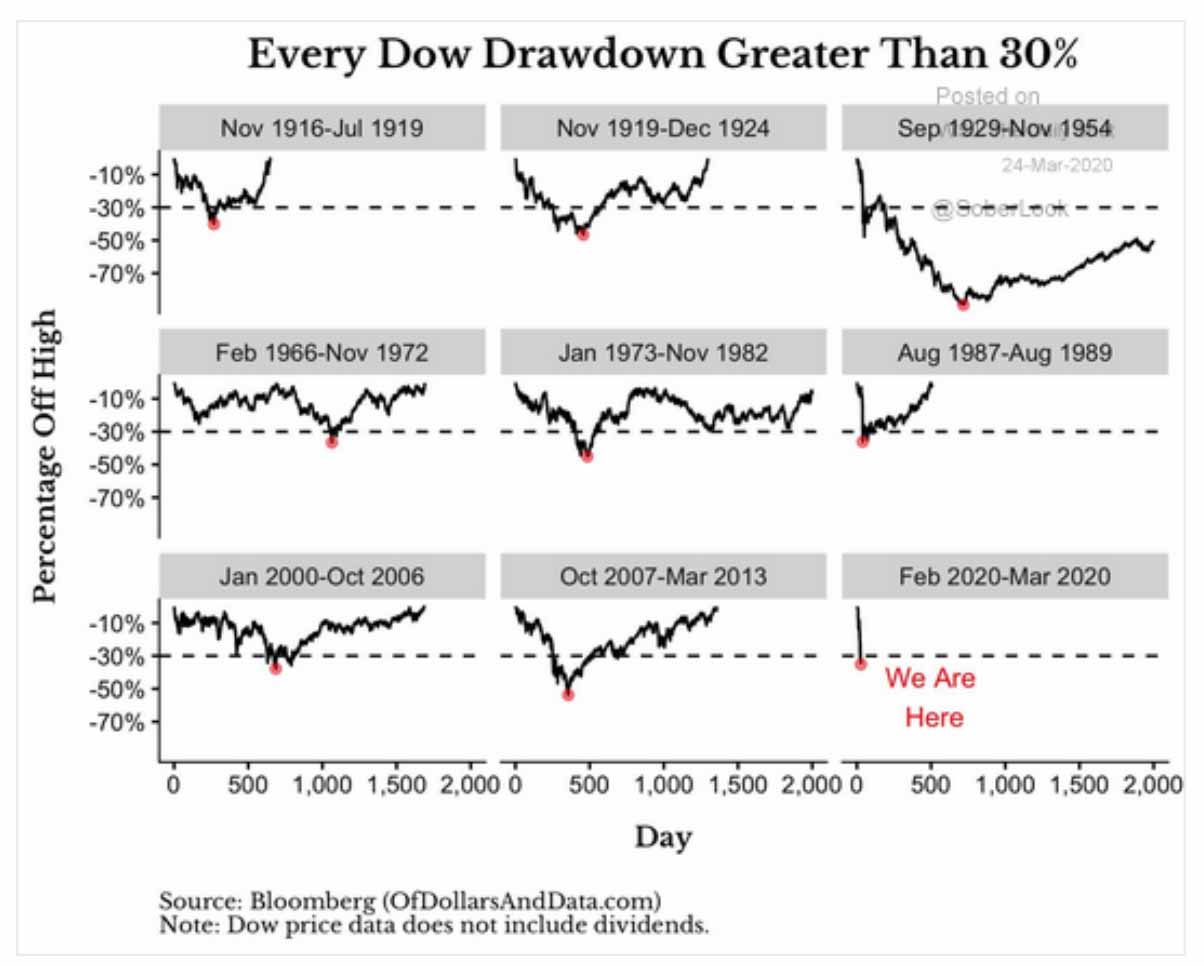
The red circle in each period represents the bottom of that market cycle. Once it reaches a bottom, the rebound is quick as the chart shows.
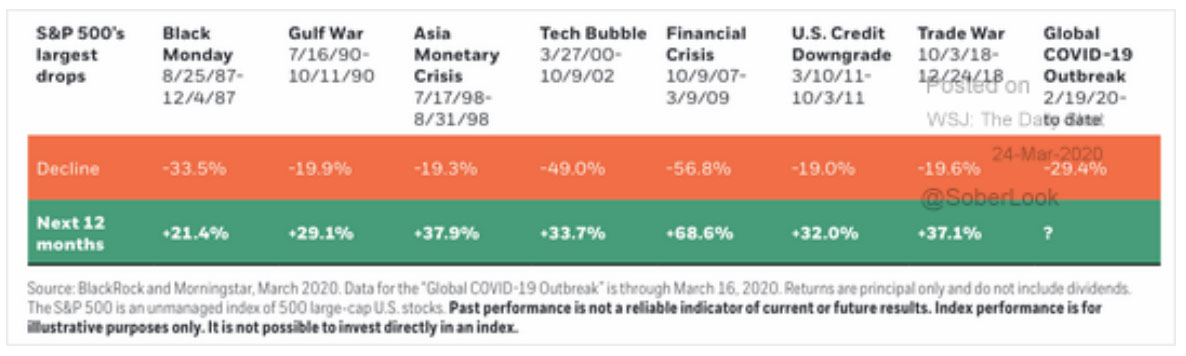
The second chart below is from the Wall Street Journal’s Daily Shot® and BlackRock. It looks at the S&P 500’s largest drops and subsequent recoveries over the next twelve months. Once the S&P 500 reaches its trough, history shows that the following twelve-month returns are strong. The average price return during these seven prior periods is +37% and the median is plus+33.7%!
3) Don't Try to Time the “Bottom”
What we can take away from all three charts is that stock market declines happen; they are part of long-term investing. While it is uncomfortable in the midst of a downturn, bear markets don’t last forever. And, history shows recoveries tend to be sharp and quick. Also, the rebound usually starts well ahead of the economic data. Trying to time the bottom can cost you as the best days in the recovery usually follow the trough in short order.
Time in the markets is more important than timing the markets. Stay invested during these uncertain times and do not let emotions drive investment decisions. Please reach out to us, we are here to work with you good times and bad. Our goal is the same as yours: to guide you to financial success over time.