
How Do Presidential Elections Affect the Stock Market?
October 17, 2020
 By Ted Hanson
Securities AnalystThe next presidential election is quickly approaching, and while there are many unknowns surrounding events like this, in the investment world, we are often asked what to expect from the markets.
Just like any other year, anything can (and likely will) happen. However, let’s take a look at what history tells us about how the market performs during election years, in particular.
Stock Market Performance in Presidential Election Years
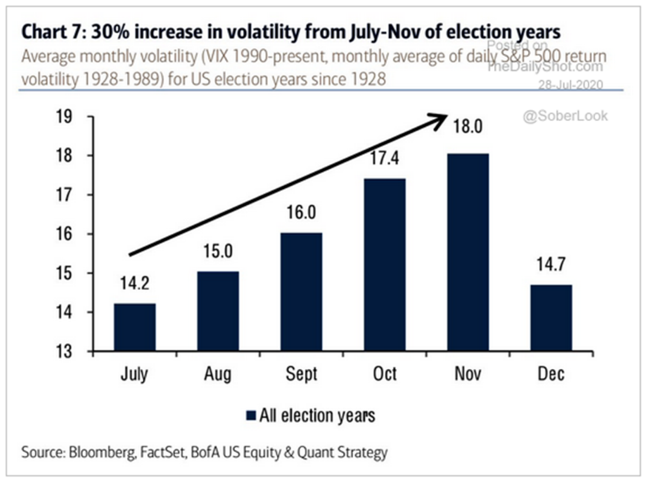
As the above chart from The Daily Shot shows, volatility tends to increase from July to November of U.S. election years — by about 30% since 1928, to be exact. Much of the additional volatility can be attributed to the increasing amount of unknown information surrounding candidates, their policies and election results. In addition, both sides of the aisle often view a victory of the opposing candidate as detrimental for the markets.
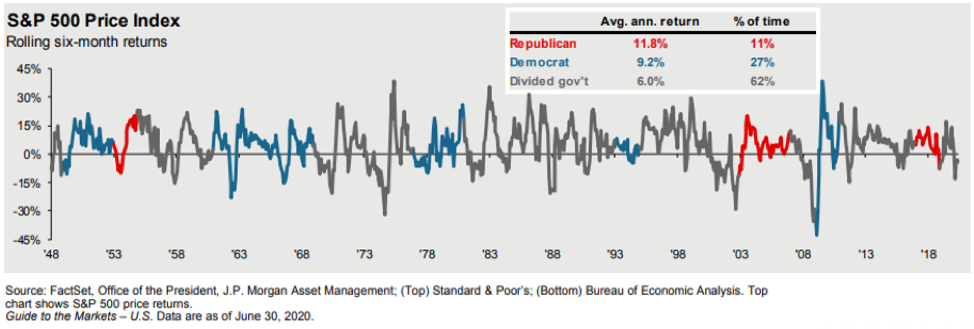
However the chart below, courtesy of J.P. Morgan’s Guide to the Markets, begs to differ. While volatility may increase during election years, that doesn’t necessarily turn into negative performance. In fact, looking at the past 20 election years, the S&P 500 ended the year in positive territory 17 times:
What are the expectations for 2020?
As for this year, what are the expectations? In short, you can expect volatility to remain elevated as we round out 2020. The chart below, from The Daily Shot, shows the standard deviation of weekly returns during various market environments (meaning, how much do weekly returns differ from the average?):
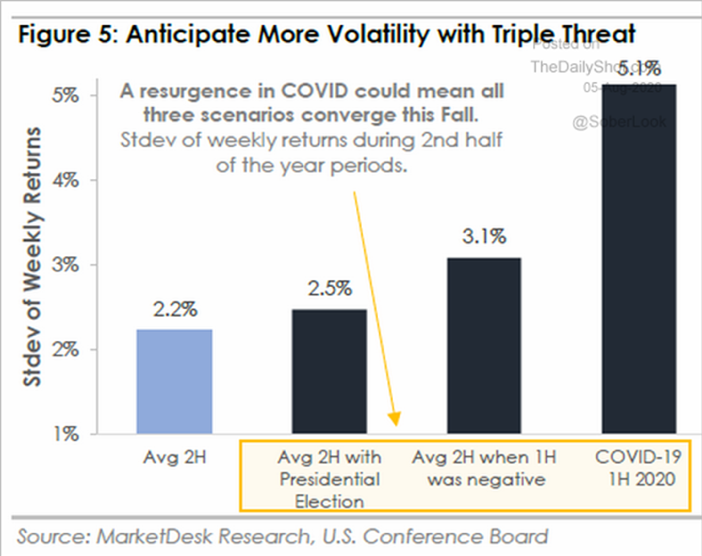
As we’ve previously discussed, volatility is elevated in the second half of Presidential Election years. Not only that, markets historically see more volatility after a negative first half of the year and COVID-19 continues to bring uncertainty. All of these factors set us up for a rocky second half of the year, as investors navigate all three of these market environments.
How does this affect your portfolio?
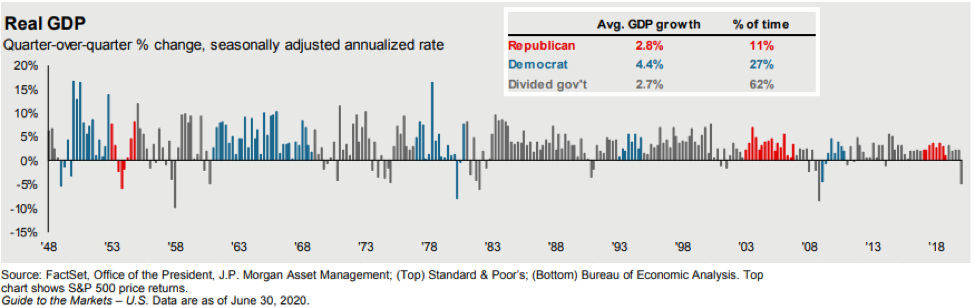
Our charge is to invest in the long-term expansion of the economy. As the below chart from J.P. Morgan’s Guide to the Markets shows, the economy often continues to move forward no matter who controls Washington:
While we may anticipate more volatility, history and markets favor those who demonstrate consistency, discipline and patience. We will remain fully invested, broadly diversified and attentive to valuations.
This also provides a good reminder for investors to review their portfolio asset allocation and overall risk. Talk to an advisor today, and let us help ensure that you are prepared for whatever lies ahead in the second half of the year.