
Market Volatility Spikes: Is This the New Normal?
February 3, 2025
 By Tom Limoges
Vice President - Investments
Over the past week, one of the stock market’s volatility indicators, the Volatility Index often referred to as the market’s “Fear” index, rose to its highest level in over a month. This move started with news that Chinese AI startup DeepSeek announced creation of a model that produced similar performance to the current standard, but at a cheaper cost – putting pressure on AI related companies. The volatile start to this week is similar as the stock markets declined due to tariffs imposed on Canada, China, and Mexico. Is this stock market volatility normal and will it continue as the year progresses?
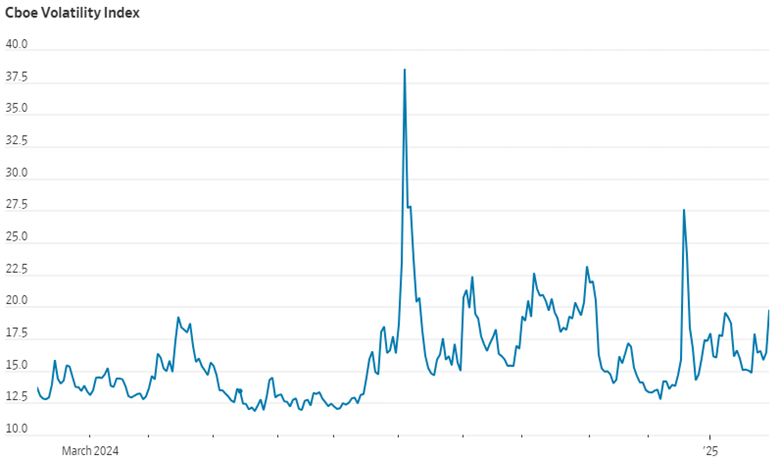
Data as of Feb 3, 2025 Source: FactSet via WSJ
VIX Background
The CBOE Market Volatility Index, or VIX, is a measurement of the market’s expectations of the relative strength in short term price changes of the S&P 500. It is often used and quoted among investors because it provides a way to quantify market risk - the higher the VIX index level, the higher degree of risk in the market at the time. The VIX generally rises when stocks fall and declines when stocks rise. While the index level recently moved higher, it remains below levels experienced over the last year.
Market Volatility – A Common Theme
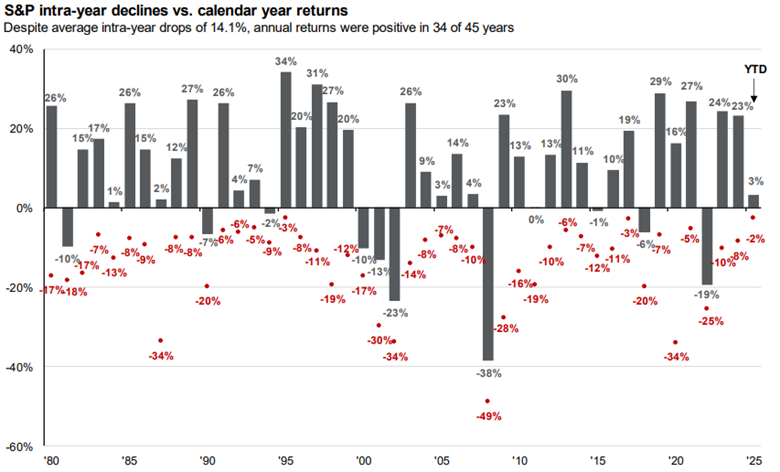
Data as of February 3, 2025 Source: JP Morgan Guide to the Markets
Market volatility appears in all sorts of shapes and sizes. From pandemics, housing and technology bubbles, geopolitical events and natural disasters, it can come in a variety of ways. The above chart, often referred to as the Pox chart, shows market annual returns (grey bars) and intra year declines (red dots). Over the last 45 years, the market’s annual return was positive over 75% of the time. Additionally, this chart shows the market’s average intra-year decline on average of 14.1%. While market volatility increased in recent weeks, keep in mind market declines are part of normal market behavior.
Markets Priced to Perfection

Data as of February 3, 2025 Source JP Morgan
Valuations can also impact market volatility. The above chart highlights the price-to-earnings, or P/E ratio, of the S&P 500. The P/E ratio is simply stated, the price of the index (or company) divided by the earnings produced. Tracked over time, this ratio gives an indication if markets are expensive or cheap. As of recent, the P/E ratio of the S&P 500 is at 22x earnings. To put things into perspective, this is not far from the high of 24x experienced in the late 1990s. There is an adage that valuations should never be considered a timing device, and markets can remain expensive (or cheap) for long periods of time. The current P/E of the market indicates lofty expectations and any type of miss from them gives rise to increased volatility.
Outlook
In the short term, our expectations are for more broad-based market growth. The last few years favored more growth-oriented companies. Market indexes are highly concentrated in a hand full of AI related stocks. Excluding those top ten names in the market index however, the rest of the market trades only at a modest premium relative to history. Corporate earnings will advance in smaller companies in the coming years, paving the way for broader market participation in some of those less loved sectors of the market. While volatility can impact the market, a broadly diversified investment portfolio dampens those affects. Please reach out to your Wealth Management Advisor if you have any questions or would like more information. Your success matters to us.