
Iran, Israel and the Markets: A Look at Global Reaction
March 2, 2026
 By Michael List, CFA, CFP®
Investment Management Officer
Over the weekend, U.S. and Israeli strikes on Iran added a new source of uncertainty and volatility to the markets. As markets reopened today, they performed largely as expected. Volatility increased, stocks traded lower, and oil and gold moved higher. In times like these, it’s important to remember that these events and volatility shocks are often temporary and short-lived.
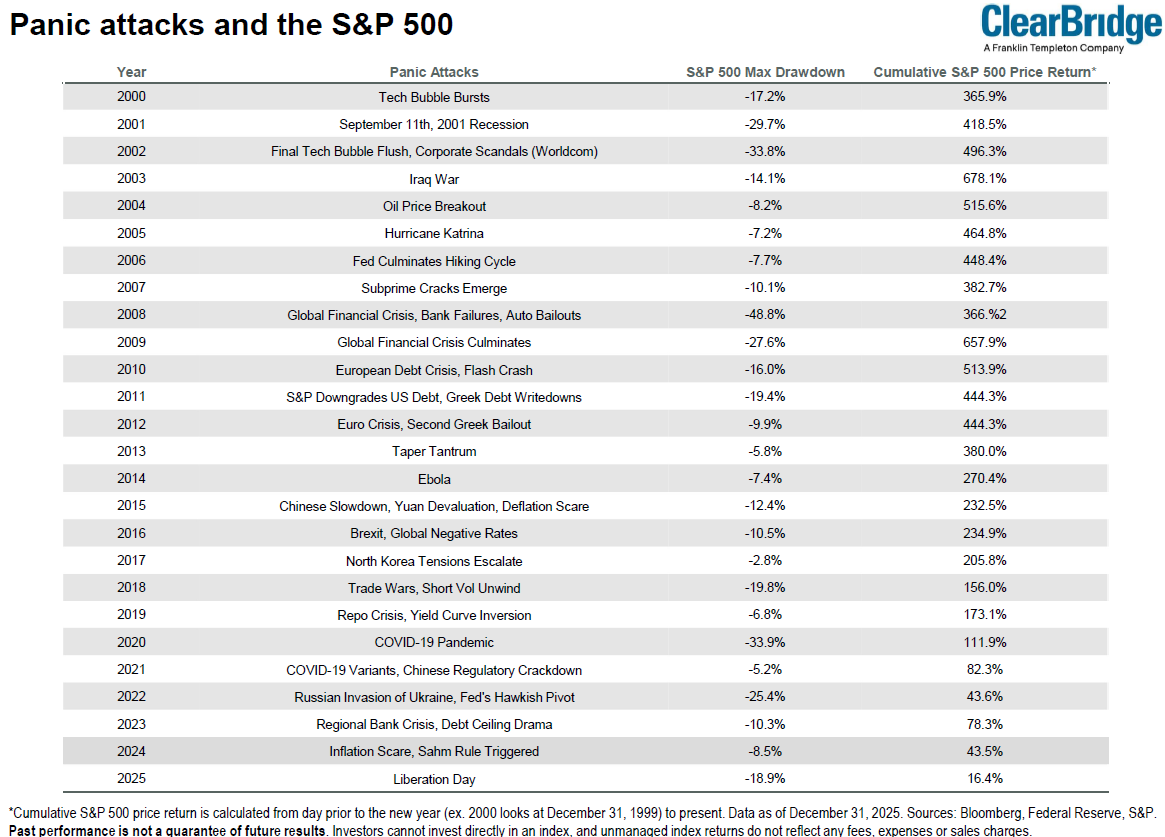
The chart below from ClearBridge highlights a couple of dozen market shocks over the past 25 years. It shows the initial market decline and the subsequent total return. There are two key takeaways from the chart. First, market shocks are common. Second, despite a mix of modest and steep declines, markets have historically recovered and moved higher over the long run.
If we think back to the beginning of February, there was another source of market volatility. Entering 2026, many expected this to be a pivotal year for Artificial Intelligence (AI). In just the first two months, AI has already been moving markets. February became something of a “who’s who” game, with investors trying to determine which industry or stock Anthropic’s Claude would disrupt next.
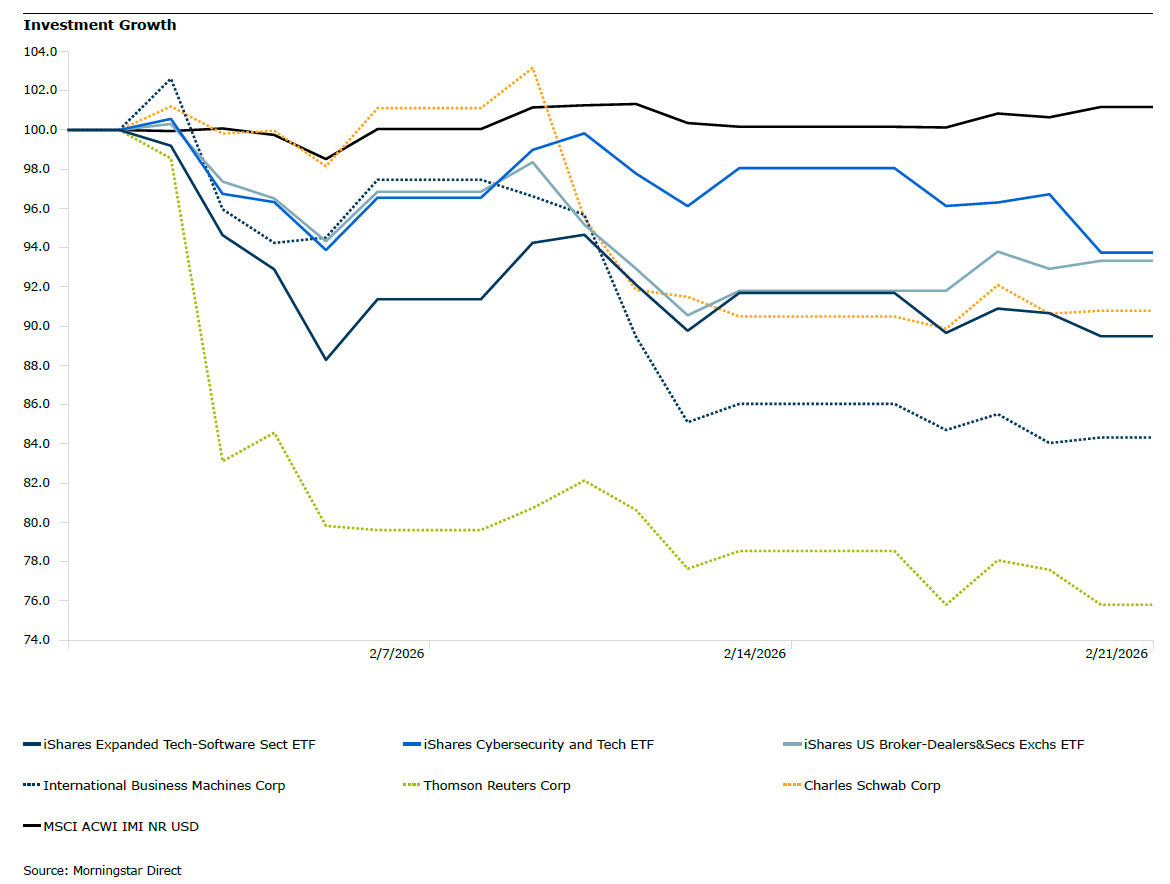
Early in the month, Anthropic introduced a new tool, Claude Cowork, an AI agent. Following the announcement, many software-as-a-service companies saw sharp declines. A few weeks later came Claude Code, which sent software and cybersecurity stocks lower. Other industries directly affected in February included private credit, insurance brokers, real estate services, and logistics. The chart below from Morningstar shows several examples of companies and industries that declined sharply following the introduction of these new AI tools. We see steep declines in both the early and middle parts of the month following the Claude releases.
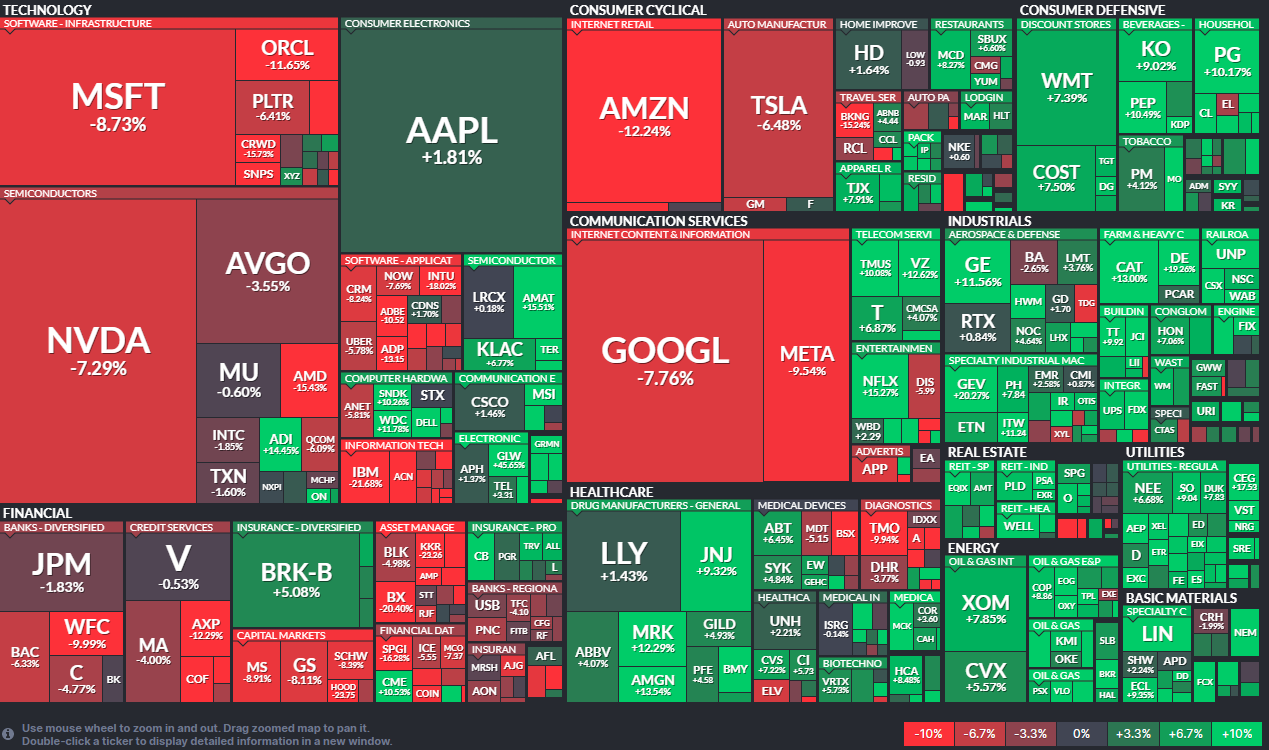
Interestingly, these selloffs led to heightened volatility within the index while the overall index remained relatively stable. The chart below from Finviz provides another perspective on this dynamic. In the chart, the size of each box represents the company’s weight in the S&P 500, while the color represents the stock’s return during February. Overall, most boxes are green (positive returns); however, many of the large boxes and industry groups mentioned above are red (negative returns).
To help manage these bouts of volatility, we build diversified portfolios and rebalance them to ensure they remain aligned with their objectives. Over the last several weeks, we have been rebalancing portfolios. After strong equity returns in 2025, this has generally meant trimming some equity exposure and adding to fixed income. This approach helps reduce portfolio risk during periods of heightened volatility. As always, if you have any questions, please reach out to your advisor today. Your financial success matters.