
The Yield Curve As An Economic Barometer
April 3, 2023
 By Michael Moreland
Retired Vice President of Investments
For centuries the primary tool to predict near term weather trends was the barometer – a tool to measure changes in air pressure that presage changes in weather patterns. For the economy, yield curve analysis is an arcane, but historically accurate, predictor of future economic activity. The U.S. Treasury yield curve is a representation of returns available on Treasury instruments of varying maturities. A ‘normal’ configuration is upward-sloping – longer term maturities carry higher yields than shorter term issues. This makes intuitive sense – uncertainty increases over time and thus markets demand higher rewards for investing longer term.
Periodically, this pattern is upended – short term rates are higher than long term rates. This is caused by two factors. First, Federal Reserve policy actions produce higher short term rates to dampen economic activity and inflation. Second, following from this, longer term rates stabilize or fall as markets anticipate a weaker environment and subsequently lower price pressures down the road. This configuration is called an ‘inverted’ yield curve, a position we are in today.
Why is this important? Keep in mind the role of the yield curve as a barometer of future economic activity. Since the mid-1970s, the yield on the ten-year Treasury note has fallen even with or below that of the companion two-year Treasury seven times (including today). In every similar period in the past, the U.S. economy fell into recession within roughly the next year.
It’s often said that the most dangerous phrase in investing is, ‘this time it’s different’. Perhaps this cycle will be the exception; after all, weather forecasts are often in error. In the fiduciary management of financial wealth, however, it’s appropriate to pay attention to the barometer.
Is This Cycle Different?
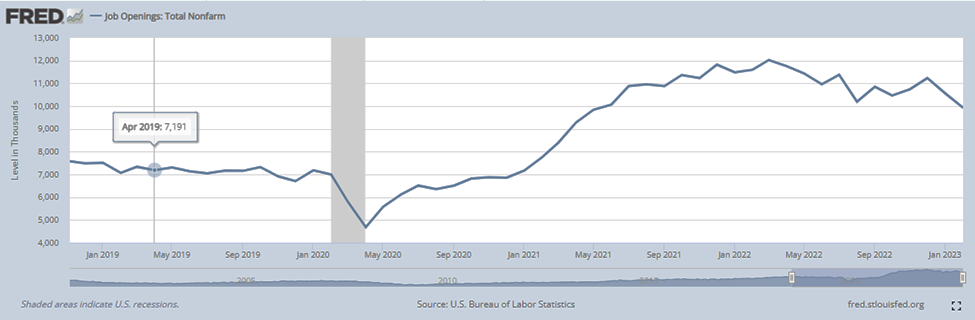
The simple answer is, ‘it’s too early to tell, but probably not’. Despite multiple rate hikes (and likely more to come), economic activity remains generally positive, and non-tech employment data show few signs of weakness despite multiple Fed moves in the last year. Inflation is moderating, although it remains well above policy targets. In its own words, the Fed has more work to do.
The challenge is the lagging impact of policy changes on broad economic conditions, as noted above. This uncertainty is heightened by the fact that in recent decades, the Fed has never pushed rates so far, so fast, to combat inflation pressures.
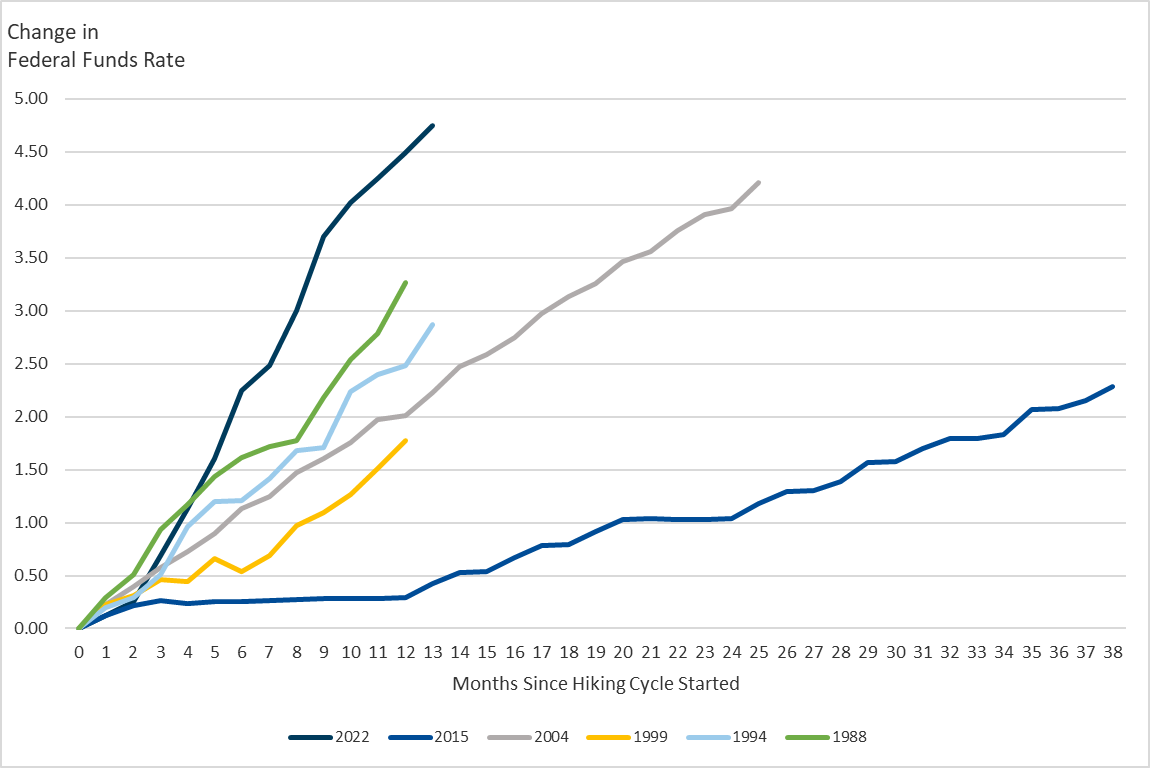
In every past cycle, a slower pace of increases allowed the Fed to judge the efficacy of its actions in a more deliberative manner. Not so this time. The speed and magnitude of recent rate hikes put the Fed too far ‘out over its skis’. By the time the lag effect takes hold throughout the economy, a ‘hard landing’ likely won’t be avoided.
The first evidence of this occurred late in the quarter with the collapse of SVB Financial Group and Signature Bank. Leverage, rapid growth in an era of free money, and concentrated asset and liability profiles combined in a ‘perfect storm’ when the Fed stomped on the monetary brakes. While management and regulatory oversight of these entities bear the fault, the rapidity and magnitude of Fed actions hindered an orderly restructuring of their balance sheets in a fast-evolving macro environment. Further rescues packages for other institutions (Credit Suisse and First Republic) followed.
Managing In Challenging Times
There are no simple solutions to avoiding chaotic markets – particularly when the focus is on achieving long term goals. At times like this, it is critical to emphasize core disciplines. Our principal rule is to build well-diversified portfolios, carrying representation in a variety of asset classes, with a tilt toward value-oriented and high quality structures.
This allocation exercise is designed to produce generally consistent returns over time with controlled risk. Many of you have seen the market sector ‘quilt’, showing returns for different asset classes on a year-by-year and annualized basis.
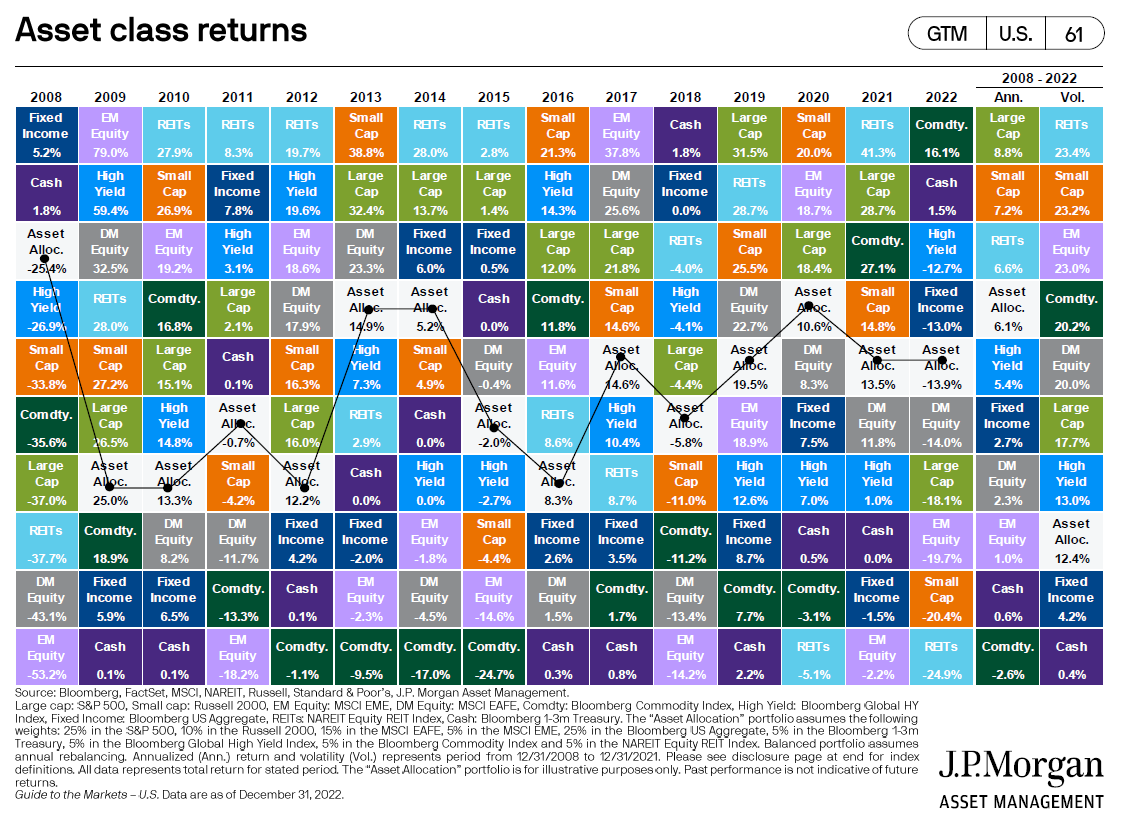
Take note of the white boxes representing diversified portfolios, particularly the far right column. Over the last several years, a broadly diversified portfolio produced solid returns with periodic volatility well below most asset classes. This is how you build wealth over time – consistent application of proven, conservative portfolio management practices. The last year has shown there can be few places to hide over the short term. Longer term, we are confident our strategies will help clients meet their specific goals with recognized and controlled risk. Please
reach out to an advisor today with any questions. Your success matters to us!