
What the Price-Earnings (P/E) Ratio Tells Us About the Market
January 8, 2019
By Colin O'Shea • Securities Analyst
At the end of 2017, there were fears that the stock market was overvalued as equity valuations rose above their historic averages. It turns out the fears were justified.
In this post, we'll take a look a common metric used by investors — the forward Price-to-Earnings (P/E) Ratio — and what the current P/E ratio means for the market in the near future.
What Is the P/e Ratio?
The price-to-earnings (P/E ratio) is a the ratio of a company’s stock market price, divided by its actual earnings per share. It is one of the most common valuation measures used by investors, to predict the future performance of a stock.
The chart below shows how the S&P 500's forward P/E ratio has performed over the past few decades. As you can see, starting in 2016 equity valuations climbed above the 25-year average of “16.1x.” But the measure promptly dropped in 2018, well below its long-term average after two-thirds of the stocks in the S&P 500 fell over the course of the year.
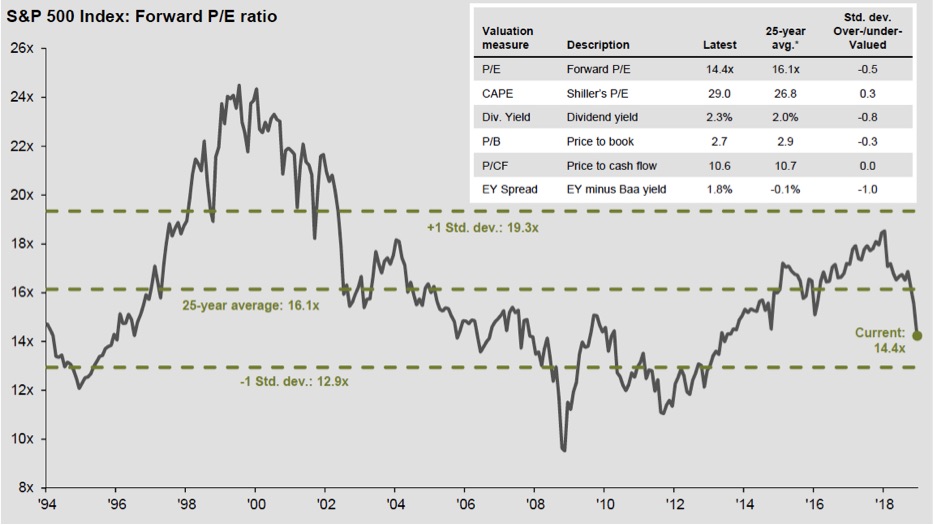
Source: FactSet, FRB, Robert Schiller, Standard & Poor’s, Thomson Reuters, J.P. Morgan Asset Management.What does a low or high p/e ratio mean?
Although anything can happen in the short term, the forward P/E ratio is an important guide to the longer-term market outlook. The following chart tells us why the price-to-earnings ratio is so important. Generally speaking, the lower the forward P/E ratio, the higher the subsequent returns (and vice-versa). For example, at the current forward P/E ratio of 14.4x, five-year returns have averaged in the low double digits. This is good news moving forward.
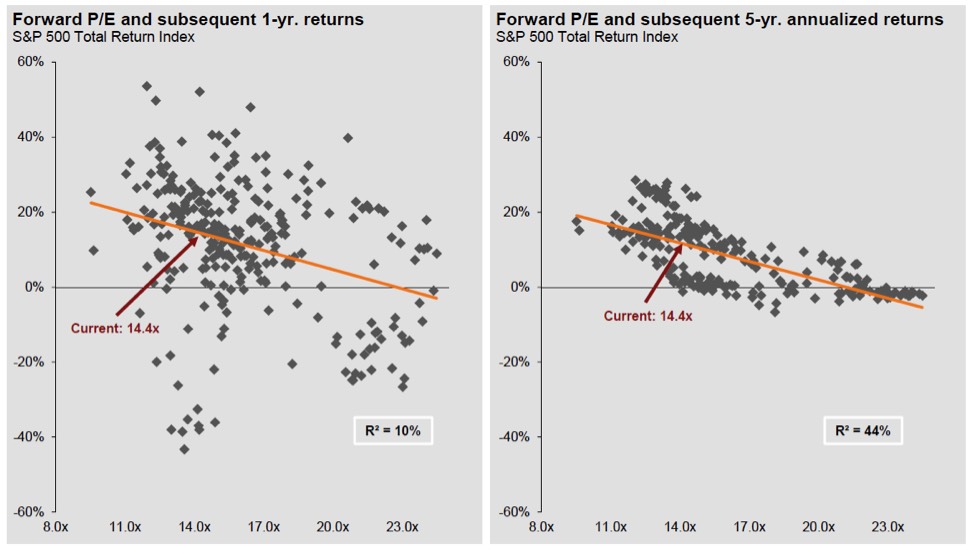
Source: FactSet, FRB, Robert Schiller, Standard & Poor’s, Thomson Reuters, J.P. Morgan Asset Management.Long-Term Stock Return Cycles
Keeping a long-term perspective helps alleviate some fear of market volatility. The following chart shows longer-term stock returns are generally positive. Furthermore, using data from 1901, there has never been a negative 20-year period.
You can further reduce volatility by having a balanced portfolio of equities and bonds. As you can see from the chart below, there has not been a rolling five, 10 or 20-year period of negative returns for a balanced portfolio.
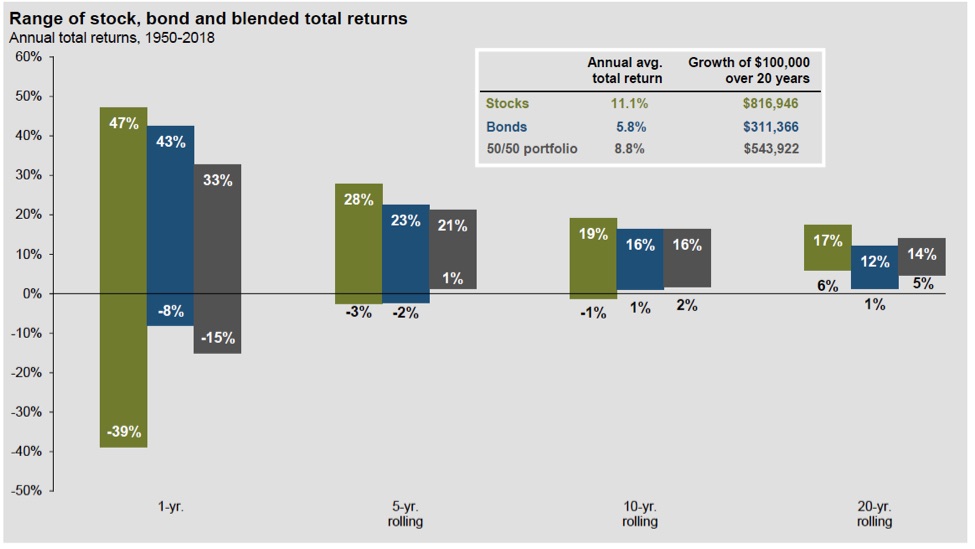
Source: FactSet, FRB, Robert Schiller, Standard & Poor’s, Thomson Reuters, J.P. Morgan Asset Management.What Does This Mean for the Market in 2019?
With a positive economic environment, along with normalized stock market volatility and valuations, 2019 could be a positive year for the market. We emphasize our philosophy of diversification and staying fully invested.Contact an advisor today to discuss any questions or concerns regarding the markets, the economy or your portfolio.