
The Yield Curve: What it is, and Why it Matters to You
February 25, 2019
By Michelle Holmes, CFA
Assistant Vice President - Investments
We do not believe a recession is coming, at least not in the near-term. Why? Look no further than the U.S. Treasury yield curve, which is an important indicator of future interest rates and economic growth. The shape of the U.S. Treasury yield curve tells us that investors expect the U.S. economy to slow, but not move into a recession in the immediate future.
In this article, we'll talk about what the yield curve is, and what it can signal for the economy.
What is the Yield Curve?
The yield curve simply plots interest rates and maturity dates for similar type bonds for a given point in time. The curve plots the interest rates or yields on the vertical axis and the length of time until maturity on the horizontal axis.
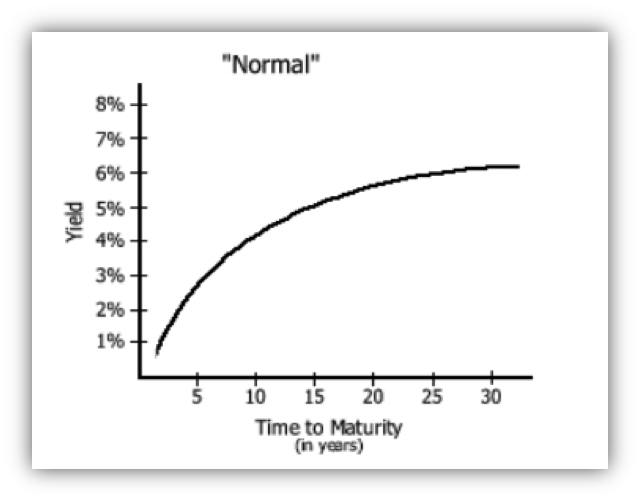
Source: Investinganswers.com
Why is the shape of the yield curve important?
The shape of the yield curve indicates what investors expect future interest rates and the economy will do. A normal yield curve is upward sloping with longer-term bonds yielding more than bonds with shorter maturity dates. This type of curve indicates stronger economic growth and higher interest rates in the future. An inverted yield curve means investors see slower economic growth and lower interest rates in the future. A flat yield curve indicates a transition period.
How Does the Yield Curve Get Its Shape?
The Federal Reserve (Fed) influences the short-end of the yield curve in an effort to balance economic growth and inflation. To do this, the Fed raises short-term rates to discourage borrowing and keep inflation in check when the economy is growing. Conversely, it lowers short-term rates to encourage borrowing when the economy is stagnating or not growing.
Investor sentiment influences the long-end of the yield curve. When investors anticipate stronger economic growth in the future, yields on longer-term bonds rise and vice versa. Yields on longer-term bonds fall when investors think economic growth will slow.
This is important because if the Fed raises interest rates too much, it could slow economic growth causing a recession. If it doesn’t raise rates enough, the economy could overheat, and inflation might spiral out of control.
Where are we today?
The yield curve is flatter than it was a few years ago. The spread or difference between the yield on the ten year and the two year U.S. Treasury note is at 15 basis points, well below the historic average of 95 basis points.
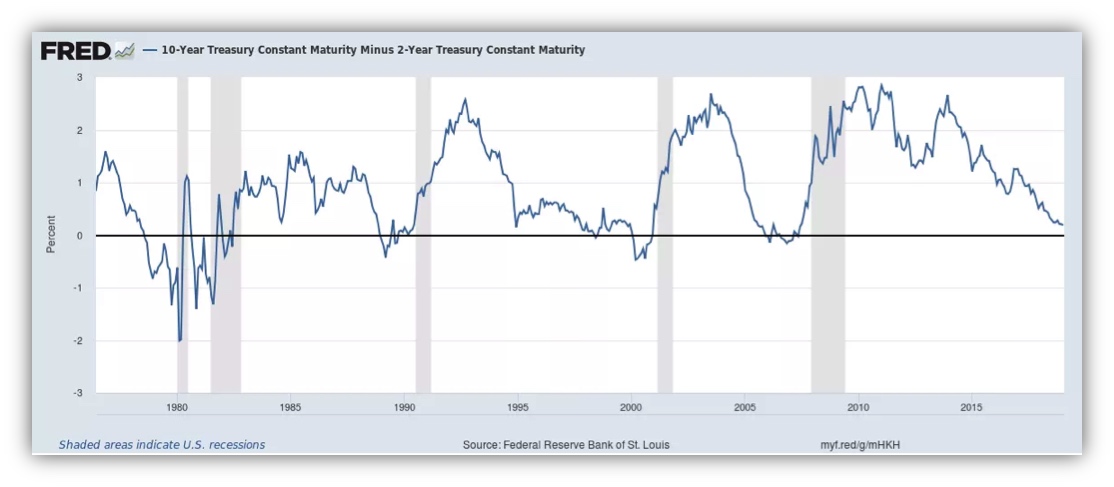
The flatter shape of the yield curve indicates the bond market expects slower economic growth in the future. Most economists predict slowing but growing economies for the U.S. and the rest of the world for 2019.
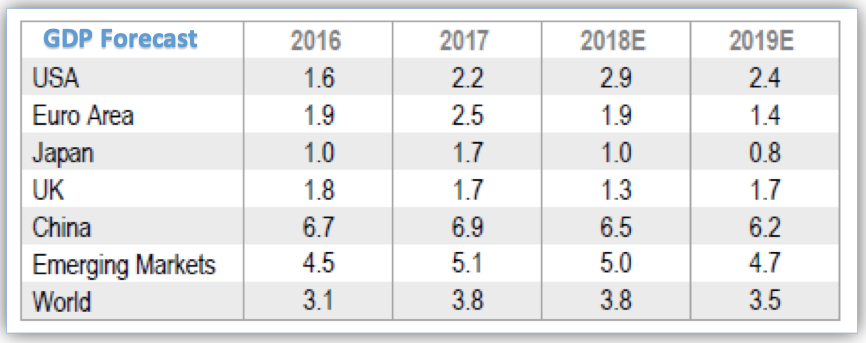
Source: Goldman Sachs Global Investment Research and GSAM as of December 31, 2018
With slower economic growth and inflation pressures stabilizing near the Fed’s long-run target of two percent, the market expects the Fed to pause and not raise interest rates in 2019.
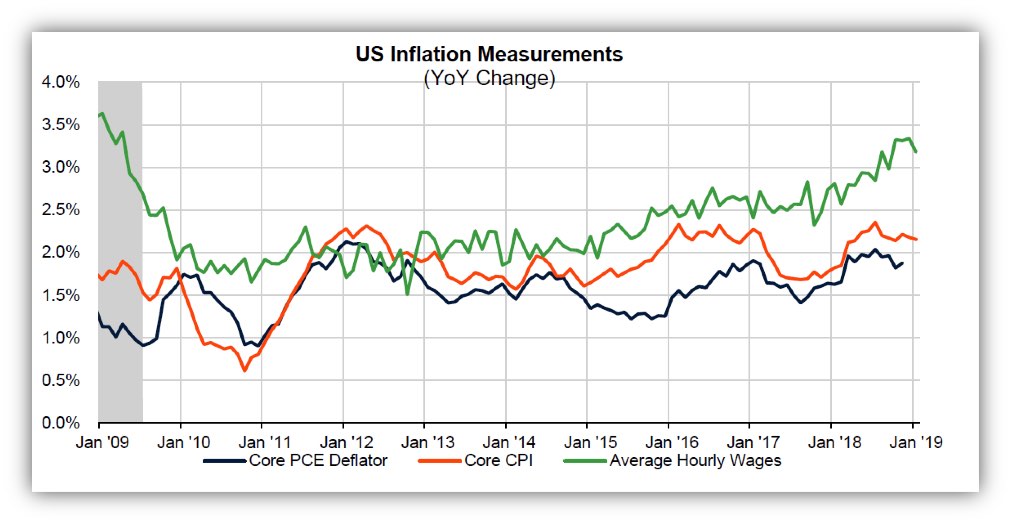
Source: Sandler O'Neill + Partners, U.S. Bureau of Economic Analysis, U.S. Bureau of Labor Statistics
Where is the Fed today?
As my colleague Krista Biernbaum pointed out the in her commentary a few weeks ago, the Federal Reserve’s views on interest rates changed dramatically over the last few months. Between November 2018 and January 2019, the Fed moved from signally that “we’re a long way from a neutral funds rate” to “we will be patient.”
The minutes from the January 2019 meeting of the Federal Reserve Open Market Committee (FOMC) suggest that the Fed wants to see inflation above its two percent target before considering another interest rate hike. This moves the Fed closer to the market views of no rate hikes in 2019.
What if the Fed continues to raise rates?
If the Fed continues to raise interest rates the yield curve could invert signaling a recession. The good news is there is time between the yield curve inversion and the start of a recession. On average, investors have nearly twenty-one months from the inversion to the start of a recession and the stock market returns are typically positive during this time.
What should you do?
Don’t panic. Check your asset allocation to see if you are appropriately invested for your stage in life. If you are diversified and your asset allocation is appropriate, then stay the course.
Over the years of managing money for our clients, we found that the best offense during times of market volatility is a good defense - having a diversified portfolio. We keep clients invested in mix of stocks and bonds appropriate to achieve their long-term goals rather than trying to pick the best time to invest in the markets. The chart below shows that this type of investment approach historically produces market like returns with less volatility.
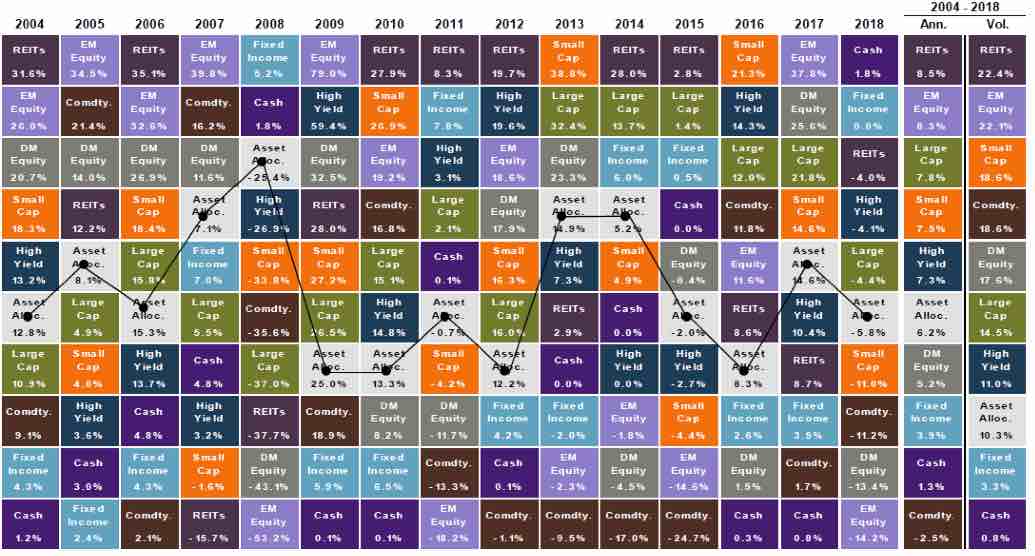
Source: J.P. Morgan -
Guide to the Markets Q2019
For more than 135 years, SNB Wealth Management has helped individuals and families turn their plans into realities. Contact one of our professionals today for an appointment and let us review your long-term financial goals.