
Inverted Yield Curve: A Dashboard Indicator for the Markets?
August 19, 2019
 By Tom Limoges
Assistant Vice President - InvestmentsRecently, I was driving when one of my dashboard indicators turned on. It was the “check engine” light. Immediately, I imagined the worst: an engine replacement. I was eager to find out what was wrong with the vehicle, so I had it inspected and it turned out I only had a malfunctioning sensor. The engine was still in good running shape.
Last week, a caution signal of a different type briefly flashed in the market, raising investor concerns about increasing volatility — something called the “inverted yield curve.” Most investors worry: is the yield curve inversion a warning of an upcoming recession and a major decline in the markets?
What is an inverted yield curve — and what does it really mean?
A “yield curve” is a line that plots interest rates, at a set point in time, of bonds having equal credit quality but different maturity dates (like comparing the interest rates on a 2-year and a 10-year U.S. Treasury bond, for example). For more information on the basics, read my colleague Michelle Holmes' breakdown on yield curves.
Much like you pay attention to the warning lights on your vehicle dashboard, economists and investment managers use the yield curve of the U.S. Treasury to gauge the health and progression of the economy.
Since bondholders tend to demand to be paid a higher rate for locking in investments over longer term periods of time, under normal growth circumstances, a yield curve should continually rise upward. This means short-term interest rates are lower than longer term rates. (Think of it like traditional mortgage rates, where 15-year home loans are usually lower than 30-year ones).
The blue line in the below chart represents interest rates for U.S. Treasury Bonds at the beginning of 2018 (notice how it rises upward, signaling growth):
Over the last 18 months, however, notice how the shape or slope of that curve has changed (or “inverted”) as short-term interest rates increase and longer-term rates decline. The current shape (red line) of the yield curve is now inverted, meaning long term rates are lower than shorter term rates.
This inverted yield curve is a rare occurrence that happens when investors become concerned over slowing economic growth and are willing to accept lower rates over longer term time periods. It's the market version of a “check engine” light, which often provides a warning that slower economic growth could lie ahead.
As you'll notice from our market commentary from a few months ago, the shape of the yield curve has actually been somewhat inverted since the end of the first quarter. Only recently did the shape of the yield curve invert further as rates on 10-year treasury bonds dipped below the yield of a two-year treasury bond. So why the concern?
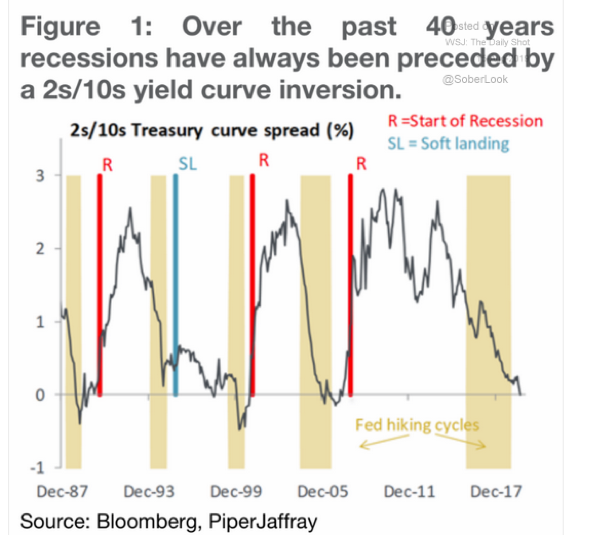
The above chart shows that historically, an inversion of the two and 10-year treasury bonds has resulted in a recession. This warning signal created uncertainty and led to last week's midweek stock market selloff. Worried investors took the inversion as an indicator that a period of negative return is in store for the stock market.
However, just like my check engine light didn’t necessarily indicate a disaster, we see from history that this inversion does not necessarily foreshadow dire consequences for the market:
S&P 500 Average Performance Following Inversion
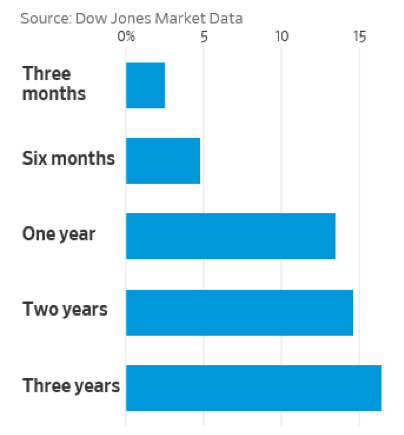
In the past, we have seen that even when an inverted yield curve occurs, the market can still produce positive returns over both short- and longer-term time periods. Additionally, it can take almost two years after a yield curve inverts before a recession begins. So while the yield curve is a good predictor of future recessions, it is not widely considered an accurate timing device. This is why at Security National Wealth Management, portfolio diversification and patience will continue to serve our clients well during this period of market volatility.
When the check engine light comes on, you take your car to a specialist to have it looked at. Here at Security National, we are the mechanics with the expertise to look at these market indicators and help you make sense of them. Reach out to one of our advisors today.